Assets Risk Report Chart
39. Assets Risk Report Chart
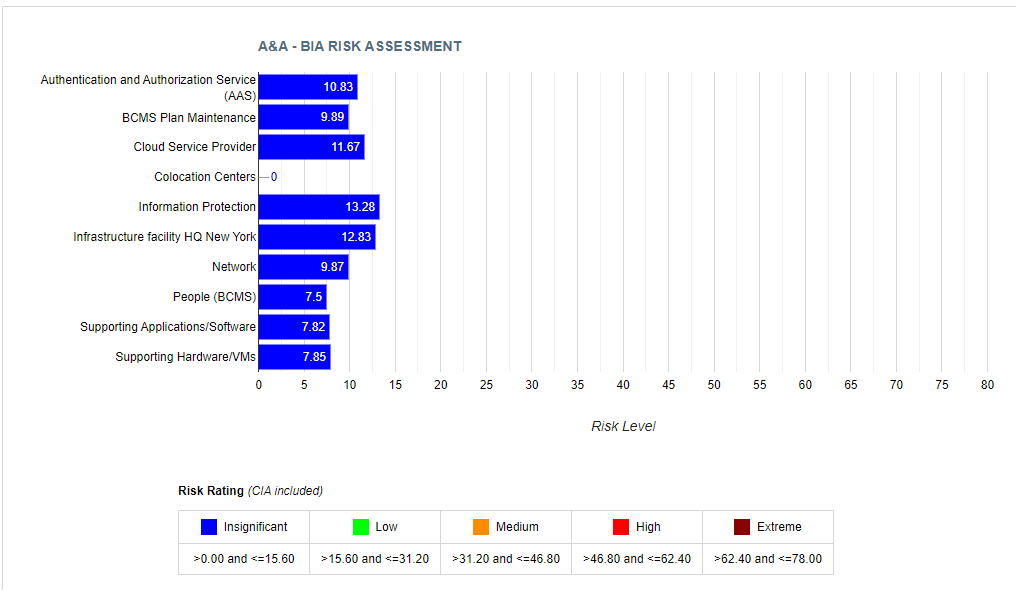
The "Assets Risk Report (Chart)" visually represents the risks associated with each asset through charts and graphs. This enables quick identification of high-risk areas and aids in efficient decision-making. The visual format simplifies complex data, making it easier to communicate risk levels to stakeholders.
39.1 Search Section
-
The Search Section enables search options to filter records as per the specific needs.
-
Navigate to Reports and click the Assets Risk Report Chart to view the screen as shown below.
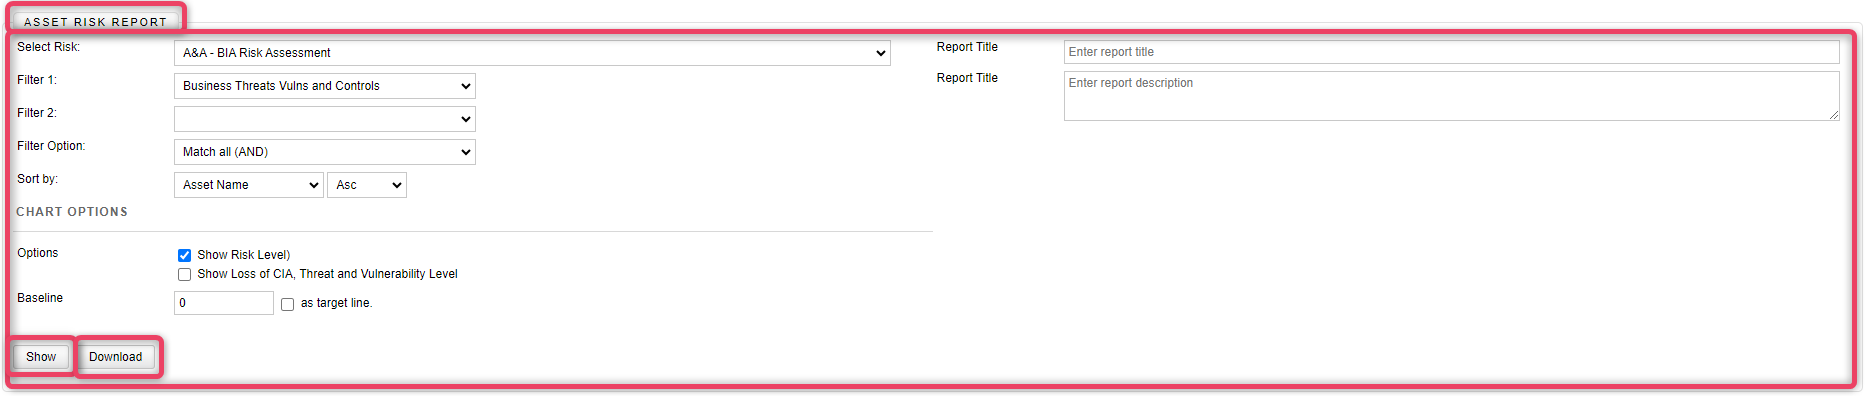
- The Show button generates the report/chart as per the selected search criteria.
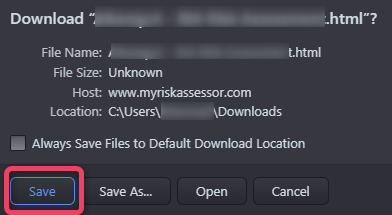
- The Save to HTML button generates the HTML export and downloads the content for later viewing.
- The system gives a confirmation prompt before saving the data. Refer to the screen below for details.
39.2 Report Section
-
The Report Section displays the report results, filtered on the search criteria selected above.